
This room was released on day three of the event and covers the basics of searching a Splunk SIEM instance.
Task 1 Introduction
This section introduces some more of the story.
Launch the Virtual Machine.
Flag
There is no question or answer for this section.
Task 2 Log Analysis with Splunk
This section covers navigation within Splunk and how to use its search features.
Navigate to the Search & Reporting module of the Splunk instance. Search all of time in the main index.
index=mainSet time the picker to All time. You should see events now.
Click on sourcetype on the left menu to see a breakdown by the most common (there are only two) sourcetypes.
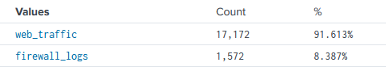
- web_traffic: This data source contains events related to web connections to and from the web server.
- firewall_logs: This data source contains the firewall logs, showing the traffic allowed or blocked.
Run another search.
index=main sourcetype=web_trafficThis query searches for events with web_traffic as source type. You could also just click web_traffic under sourcetype on the left menu to achieve the same result.
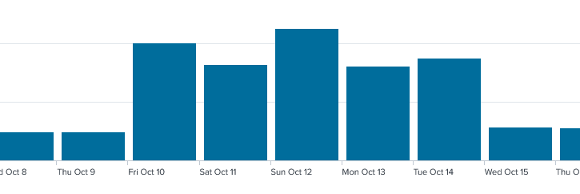
index=main sourcetype=web_traffic | timechart span=1d countThis groups the results by days and counts them. This is a useful way to spot unusual activity by spikes over time.
Click the Visualization tab to show results as a chart.
Flag
2025-10-12
Run another query to order results by quantity.
index=main sourcetype=web_traffic | timechart span=1d count | sort by count | reverseThis sorts the daily event count in descending order.
While the default for the sort function in Splunk is ascending, there are many ways (other than piping to the reverse function) to specify a different order. See Splunk’s Sort Documentation for other options.
Go back to the Events tab.
Click user_agent on the fields list (left menu).
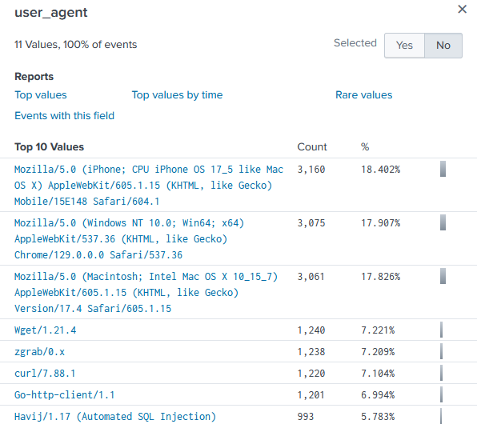
The user_agent field stores the software that was used to interact with a web service. This would typically be the browser and will usually include details about the operating system it was running on. You can see even in this short list there are some suspicious entries that may require further investigation.
Flag
993
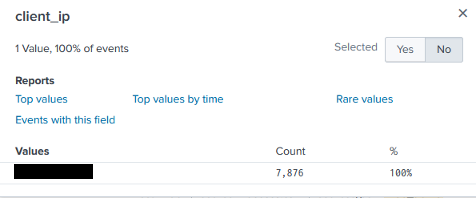
Click client_ip on the fields list (left menu) next.
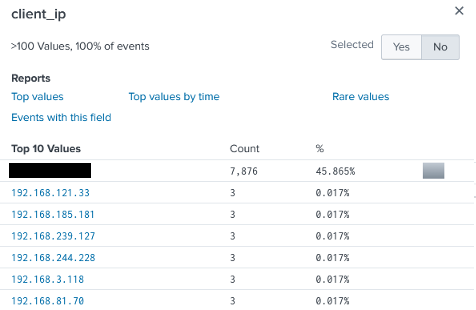
The client_ip field stores the source of the requests made across a network. Again, we can spot some suspicious activity by simple volume.
Click on path from the fields list (left menu) next.
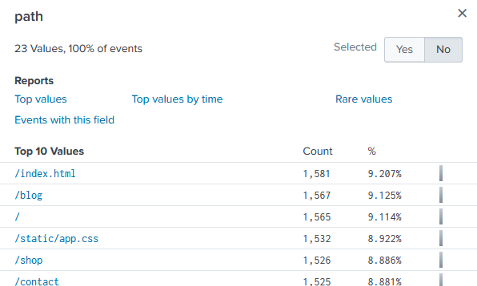
The path field stores the URL requested by the client. This can often be used to identify unusual requests.
Run a query to look for less common user_agent values.
index=main sourcetype=web_traffic user_agent!=*Mozilla* user_agent!=*Chrome* user_agent!=*Safari* user_agent!=*Firefox*This query looks for web traffic from uncommon user agents. It does this by specifically excluding normal values (Mozilla, Chrome, Safari, Firefox).
Click on client_ip to see that all values come from a single source.
Run another query to validate our findings.
sourcetype=web_traffic user_agent!=*Mozilla* user_agent!=*Chrome* user_agent!=*Safari* user_agent!=*Firefox* | stats count by client_ip | sort -count | head 5Flag
198.51.100.55
This query sorts results in reverse order while limiting returned results to five.
Time to look for how initial access was made now that we can narrow it down to a source IP address.
sourcetype=web_traffic client_ip="<IP ADDRESS>" AND path IN ("/.env", "/*phpinfo*", "/.git*") | table _time, path, user_agent, statusThis query looks for requests for critical resources that can allow access from the suspicious IP address.
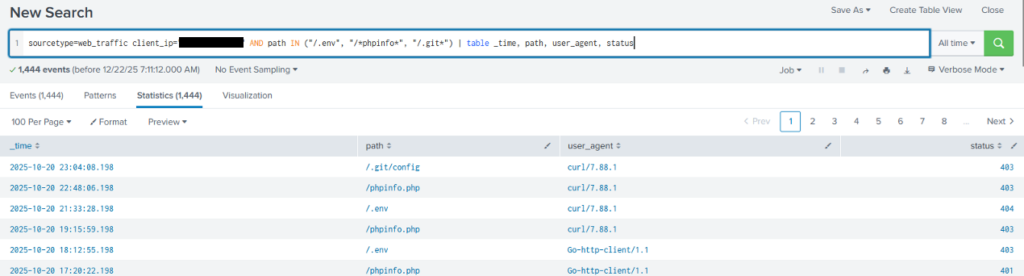
We can see that requests to critical locations were made with a variety of low level tools, and that they didn’t go through (last column for HTTP response code).
Time to look for path traversal attempts.
Path traversal is a technique that manipulates values in the URL to access directories and files outside the expected region. This is done using dot-dot-slash (../) and its variants in an absolute path. For more information see the OWASP path traversal reference.
sourcetype=web_traffic client_ip="<IP ADDRESS>" AND path="*..*" OR path="*redirect*"This query looks for attempts to use path traversal.
sourcetype=web_traffic client_ip="<IP ADDRESS>" AND path="*..\/..\/*" OR path="*redirect*" | stats count by pathThis query is updated to factor in character escaping and then counts by path to identify unique path attempts.
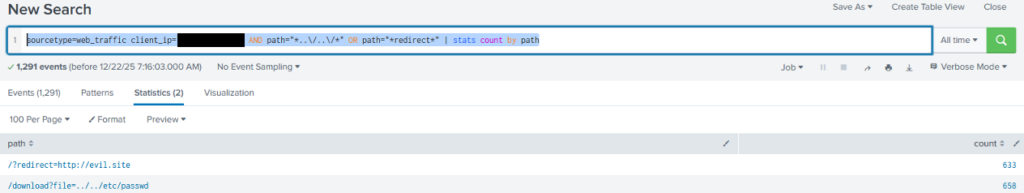
From the results we can see the paths that were attempted.
Flag
658
Lets look for SQL injection attempts next.
SQL injection is a technique where SQL code is put into input fields to have it executed by the server. For more information see the OWASP SQL injection reference.
sourcetype=web_traffic client_ip="<IP ADDRESS>" AND user_agent IN ("*sqlmap*", "*Havij*") | table _time, path, statusThis query looks for user_agent values associated with common SQL injection tools then displays the results in a table.
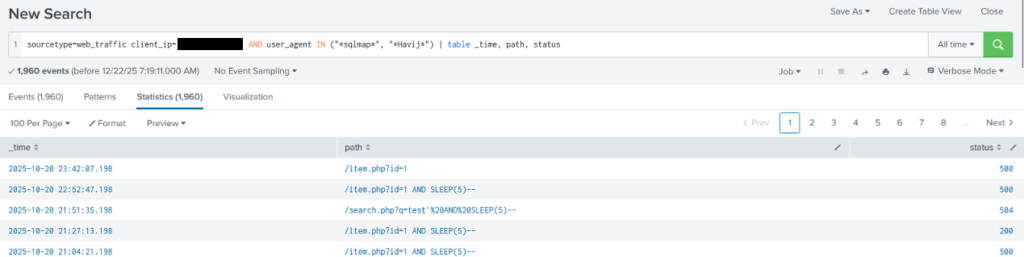
We can see from the use of SLEEP(5) in many queries that attempts were being made at SQL injection, some of which were successful.
Next, lets look for data exfiltration attempts.
sourcetype=web_traffic client_ip="<IP ADDRESS>" AND path IN ("*backup.zip*", "*logs.tar.gz*") | table _time path, user_agentThis query looks for common compressed file names in path values then displays the results in a table.
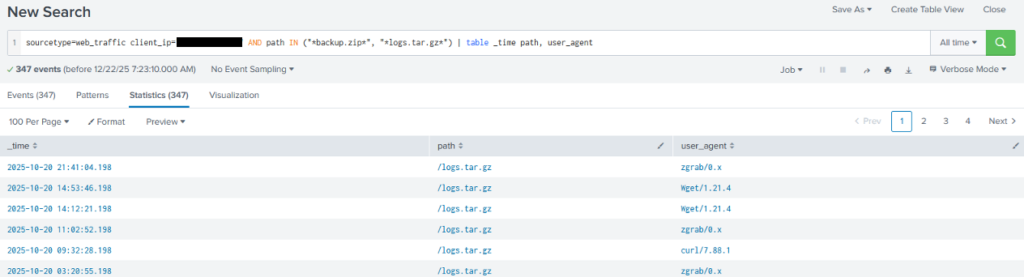
Results indicate a fair amount of data exfiltration probably occurred. Definitely worth following up.
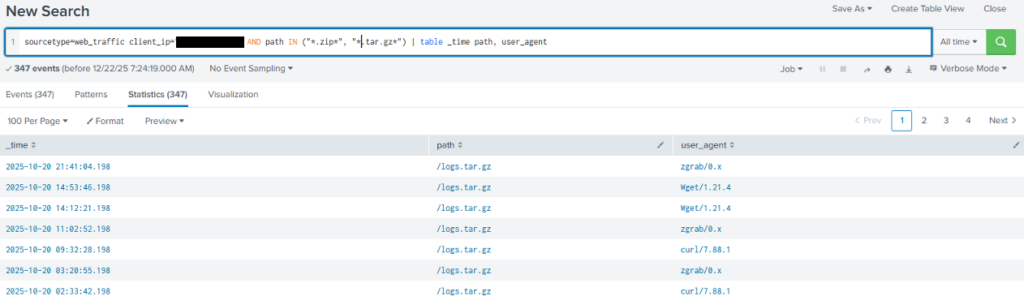
Note that the previous query is looking for specific filenames, which means it would miss an alternative naming convention even if they were similar archive files. Starting more general and narrowing your focus can help minimise missed events.
Time to follow up the suspicious functions identified in other logs.
sourcetype=web_traffic client_ip="<IP ADDRESS>" AND path IN ("*bunnylock.bin*", "*shell.php?cmd=*") | table _time, path, user_agent, statusThis query looks for the staging command execution.
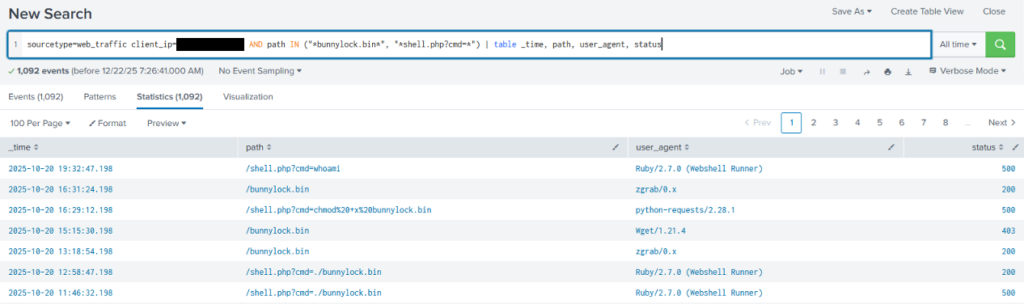
Note the indications of remote execution.
Lets switch to searching the firewall logs for communication from the server and the suspicious IP address.
sourcetype=firewall_logs src_ip="10.10.1.5" AND dest_ip="<IP ADDRESS>" AND action="ALLOWED" | table _time, action, protocol, src_ip, dest_ip, dest_port, reasonThis query searches for logs from the firewall to the suspicious IP address where it was allowed through and then displays them as table.
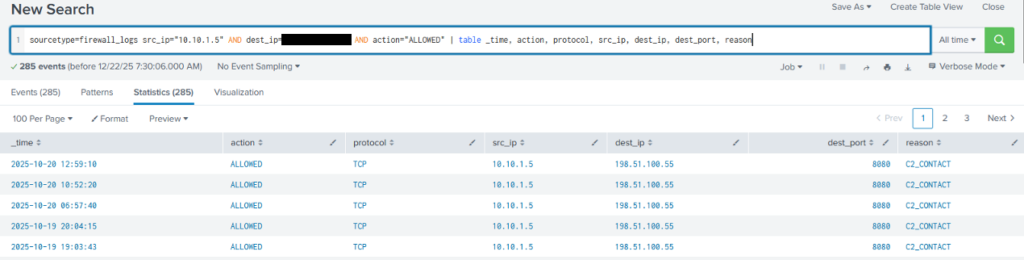
In the search results we can see there were outbound communications labelled C2_CONTACT. Seems suspicious.
sourcetype=firewall_logs src_ip="10.10.1.5" AND dest_ip="<IP ADDRESS>" AND action="ALLOWED" | stats sum(bytes_transferred) by src_ipThis query uses statsfunctions to determine how much data was exfiltrated by adding all transfers together.
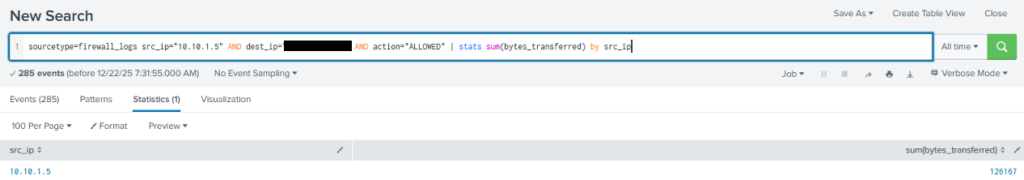
Flag
126167